|
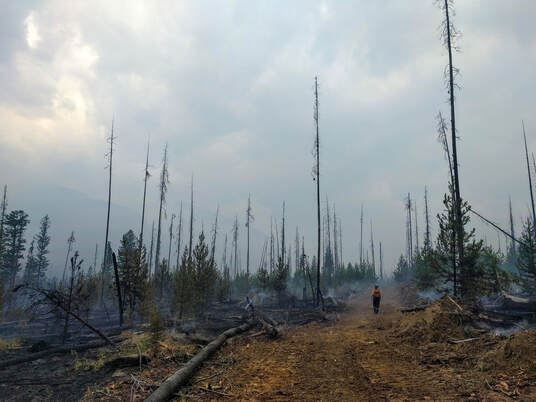
Wildfires are natural and deliver important ecological benefits. Fire management agencies are challenged to support fire on the landscape without exposing people or values to an unacceptable risk. If you can map locations where fires are likely to stop, the decision to let a fire burn gets easier. In this study, we used the mapped edges of a large wildfire to identify the specific conditions tied to fire stopping points. Our hope was that this information could help fire managers identify locations in their management areas where future fires can be accommodated.
When a wildfire passes through an area, it leaves a pattern of burned and unburned patches that express complex underlying characteristics of the fire environment. The fire environment is described by topography, weather, and fuels, and includes constructed anthropogenic features such as roads. Fire managers intuitively know that some fire environment features like large waterbodies are likely to stop a fire; however, more complex overlapping interactions require analysis. When we studied the perimeter of the 2017 Verdant Creek Fire in the Western Canadian Rocky Mountains, we found that fire cessation was more likely in non-fuels, alpine and subalpine vegetation, wetland areas and low and sparse shrub assemblages, generally associated with avalanche paths and near waterways. |
|
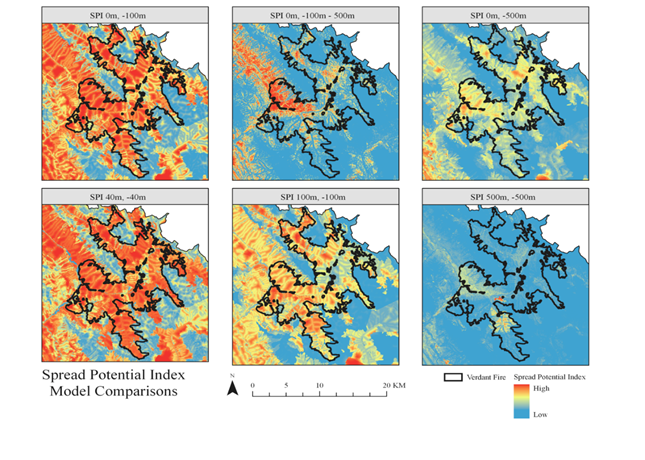
If conditions supportive of fire containment are known in advance, it may be possible to let future fires spread within those contained areas or zones - which can deliver ecological benefits and avoid unnecessary suppression costs. You can use our model to map likely fire stopping points across a management area, which we call a Spread Potential Index (SPI). Locations with low spread potential have a higher probability of being a fire perimeter and are expected to slow fire growth. In contrast, an area with higher spread potential will have a low probability of being a fire perimeter and can be expected to sustain fire spread.
As part of this study, we wanted to better understand how our choices about sampling points influenced results. Fire edges are mapped as lines but in reality, these areas are more like fuzzy transition zones, or belts. To ensure we were actually studying the fire edge (i.e., with sample points positioned in discrete burned and unburned areas), we had to ensure paired burned/unburned points were separated by a sufficient distance. Prior studies of fire edges ignored this issue and offered little insight. So we used a sensitivity analysis to explore various sample distances between burned and unburned areas to determine which models best predicted the formation of the fire edge. Sampling points 100 m inside and outside the mapped fire edge produced the best results. |


